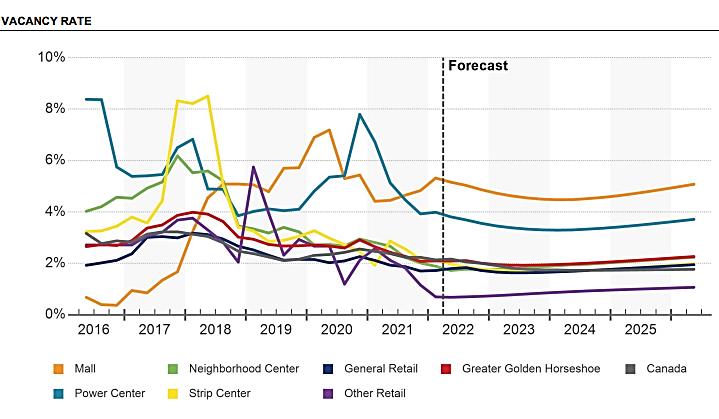
For the Greater Golden Horseshoe region, vacancy rates are at an average 2.1%. In the 427/Bloor/Islington corridor and Oakville, there are higher vacancy rates, with lower vacancy rates can be found in Steeles/Wodbine and in Yonge/St. Clair.
Greater Horseshoe 12 Month Sales Volume & Price (CoStar Chart)

Toronto 12 Month Sales Volume & Price (CoStar Chart)

Notable mid market Investment Sales Transactions between $10M and $50M
- In Toronto, 2500 Don Mills Rd sold for $47,000,000 with a price per sf of $8,848 – buyer Donshep Developments Ltd.
- 83 Bloor St W sold for $30,000,000 with a price per sf of $2,158 – buyer Parallex Investment Corp.
- 744-758 Mt Pleasant Rd sold for $37,000,000 with a price per sf of $2,376 – buyer BAZIS.
- In the Greater Horseshoe area, recent significant sales included the BMW property at 527 N. King Street, which had a price per sf of $508 and a total sales price of $10.7 million – buyer Policaro Group
- Colborne Place at 603 Colborne St recently sold for $11.15 million, with a price per sf of $158 – buyer GK York Management Services Ltd.
Retail Leasing – Trends at a Glance
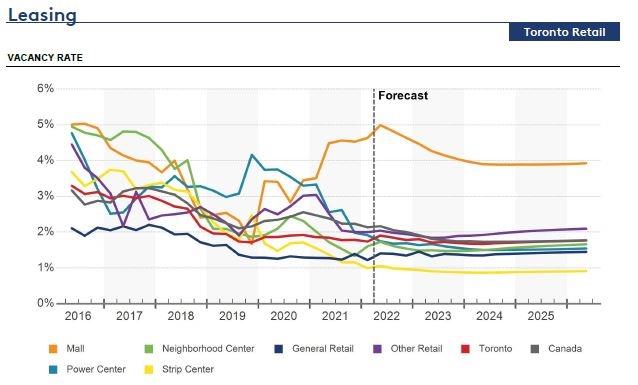
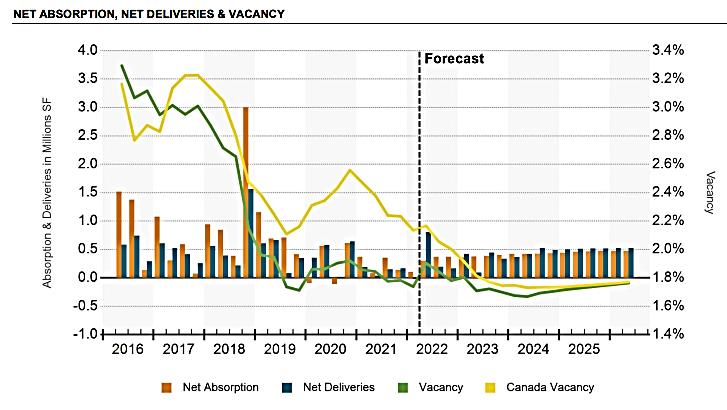
In the Toronto region, the vacancy rate is 1.7%, accounting for a 12-month rent growth of 1.9%. Mall vacancies still outstrip all other asset types, while strip centres, traditionally in the middle of the back are now boasting the lowest vacancy rates in all classes. The pandemic drove tenants away from enclosed centres and out to the neighbourhoods where working from home has driven up local suburban demand.
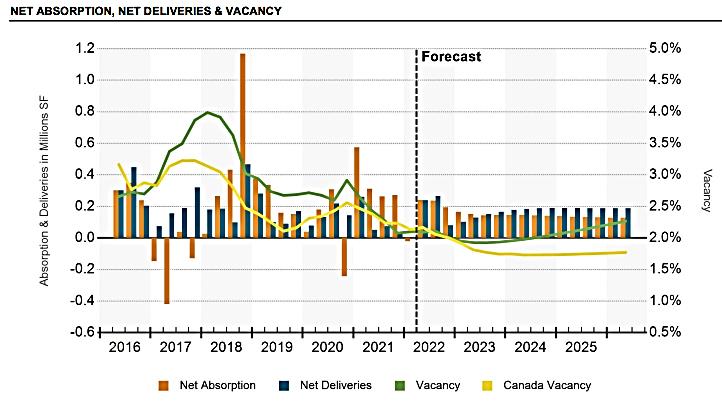
In the Greater Golden Horseshoe area, there is a 2.1% vacancy rate, reaching a 12 month rent growth of 2.0%.
Below the latest publish CoStar charts illustrate the story:
Toronto:
Greater Golden Horseshoe:
Construction Activity:
- In the Greater Golden Horseshoe region, Waterloo County had the largest number of buildings constructed at 8, with an average sf of 25,108, which shows an increased size of building than the all-existing average of 13,789 sf.
- Hamilton County saw 5 new buildings constructed with an average sf across them of 15,408, which is also much larger than their all-existing average of 8,731 sf.
- In Toronto there are 74 properties under construction at present, which represents 0.8% of the total inventory.
- In the Greater Horseshoe area there are 20 properties under construction at present, which represent 0.4% of the total inventory.
- Large properties under construction in Toronto at present include 5250 Yonge St. developed by G Group Developers, with a sf of 79,516, due to complete in July 2022.
- Another large property, 9999 Markham Rd., being developed by Villarboit Development, a 75,200-sf property, is due to complete October 2023.
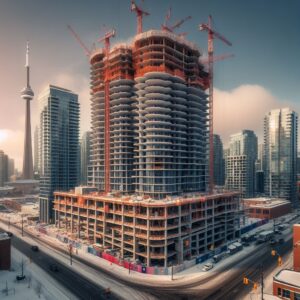
- Toronto is the city with the most cranes in North America, which service residential projects in the mainstay and mixed-use residential and commercial office space towers.
- Outside of the Toronto downtown city region, there has been a boost in both leasing and in construction activity. In the Yonge and Eglinton submarket, there is an anticipated high-rise development opening of the Eglinton LRT, which will see a benefit to retailers through increased foot traffic.
Average Sales Price per SF by City
Greater Golden Horseshoe:
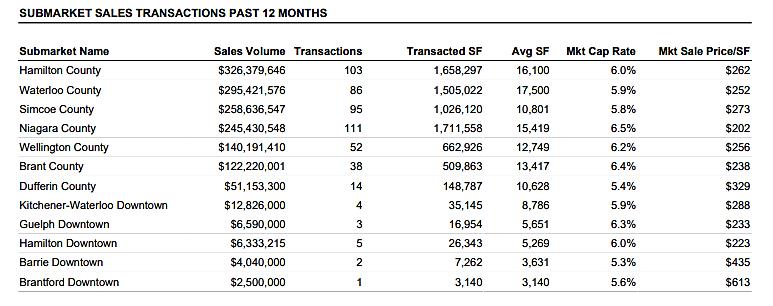
The chart shows the highest number of transactions were in Niagara County, followed by Hamilton and Simcoe Counties. The highest Cap rates can be found in Niagara at 6.5% with the lowest in Barrie Downtown. The highest market sales price per SF was in Brantford Downtown at $613 with the lowest being in Niagara at $202.
Larger property sales account for more transactions across the GTHA region, with buyers showing a preference for space to create mixed-use and essential retail spaces.
Selected GTA Submarket Sales Transactions:
| Submarket Name | Sales Volume | Transactions | Transacted SF | Average SF | Mkt Cap Rate | Mkt Sale Price/SF |
| Scarborough | $350,895,831 | 46 | 878,510 | 19,098 | 4.6% | $503 |
| Southeast Toronto Region | $289,949,081 | 121 | 500,509 | 4,136 | 4.5% | $546 |
| Oakville | $266,636,593 | 64 | 550,484 | 8,601 | 4.7% | $457 |
| West Toronto Region | $254,663,594 | 107 | 398,836 | 3,727 | 4.4% | $533 |
| Peel | $209,602,178 | 67 | 612,823 | 9,147 | 4.6% | $437 |
| Vaughan | $201,504,433 | 15 | 317,745 | 21,183 | 4.5% | $516 |
| Central West Toronto | $197,985,757 | 50 | 211,255 | 4,225 | 4.4% | $604 |
| York | $191,838,841 | 57 | 768,263 | 13,478 | 4.6% | $475 |
| Bloor/Yonge | $190,519,908 | 26 | 130,003 | 5,000 | 4.1% | $829 |
| Markham/ Richmond Hill | $183,406,234 | 35 | 297,148 | 8,490 | 4.5% | $522 |
| Durham | $150,681,003 | 39 | 518,487 | 13,295 | 5.1% | $291 |
| DVP South/ Don Mills/ Eglinton | $150,037,410 | 11 | 239,979 | 21,816 | 4.4% | $629 |
Q1 2022 closed with historically low vacancy rates and increasing net asking rental rates.
Tenants looking for space continued to encounter limited options


