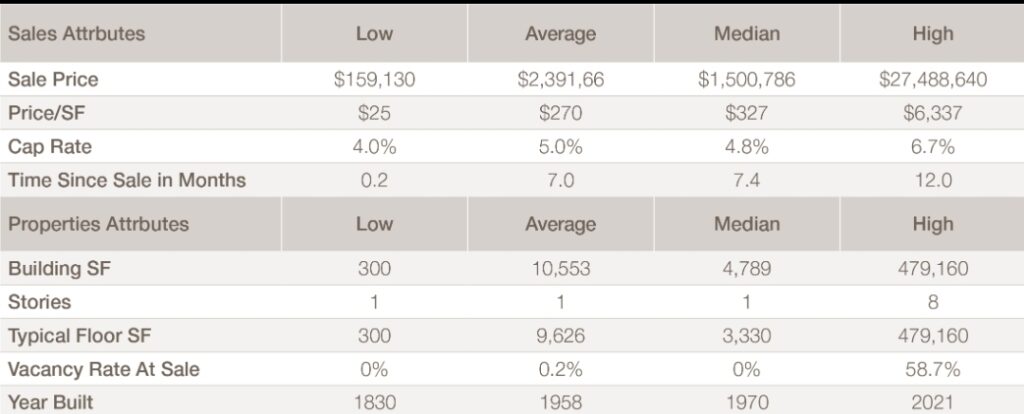
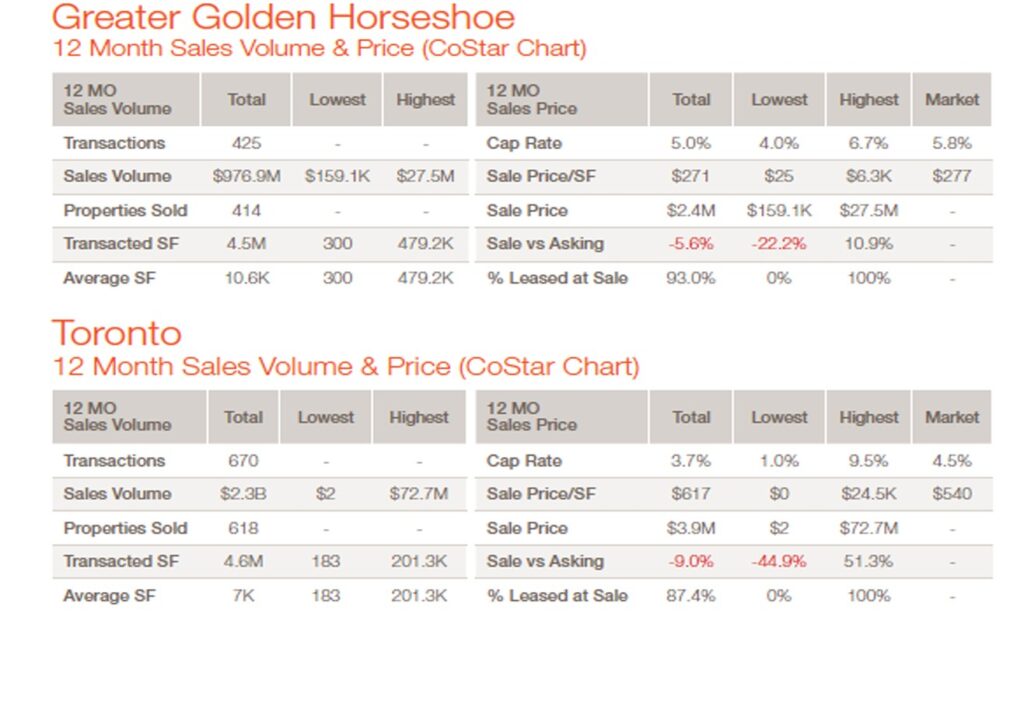
The average cap rate in the Greater Golden Horseshoe is staying strong at 5%. The average price/sq. ft is $270, with the higher end hitting upwards of $6.3k. The average vacancy rate is at a low of 0.2% for the area.
Retail pricing and cap rates remain in a period of flux given underlying shifts in fundamentals and capital market conditions. While retail buyers and sellers are in price discovery mode, we are seeing signs of average cap rates adjusting higher in some retail segments. Time will tell whether sharply higher interest rates, growing cautiousness by lenders and heightened economic risks further re-enforces this situation.
Notable Mid Market Investment Sales Transactions
Between $10M and $50M
West Toronto
• 60 Fieldway Road sold for $72,700,000 with a price per sq. ft of $4.7k – Buyer:
EllisDon
• 952 King Street West sold for $36,200,000 with a price per sq. ft of $24.5KBuyer:
Greenwin
• 690 Evans Avenue sold for $31,400,000 with a price per sq. ft of $748- Buyer:
Cadillac Fairview
Downtown Toronto
• 585-597 Queen St sold for $51,200,000 with a price per sq. ft of $573- Buyer:
Choice Properties Real Estate
Midtown Toronto
• 15 Bloor Street West sold for $37,900,000 with a price per sq. ft of $1.9k –
Buyer: Reserve Properties
Retail Leasing – Trends at a Glance
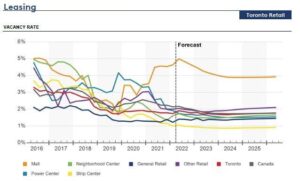
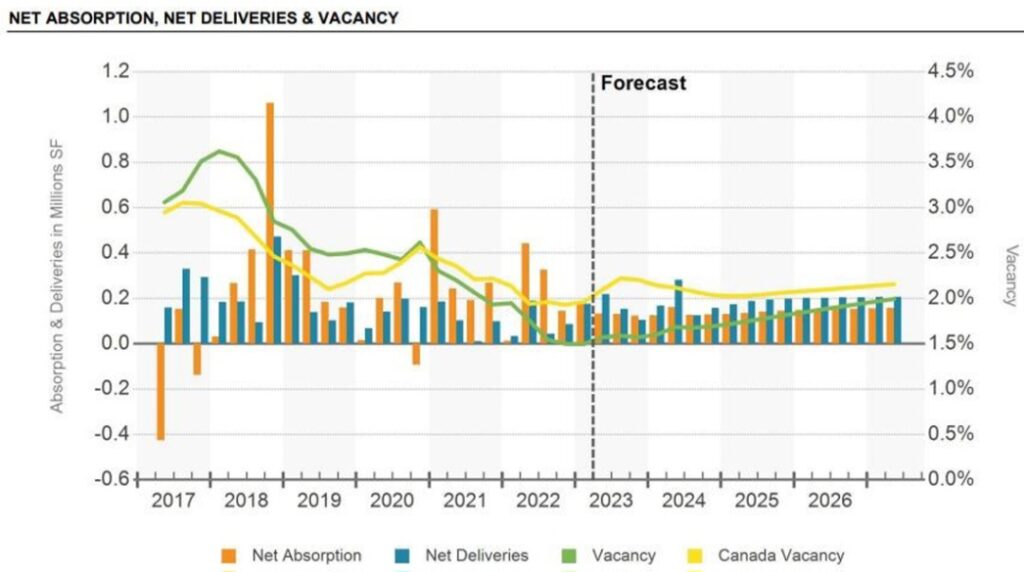
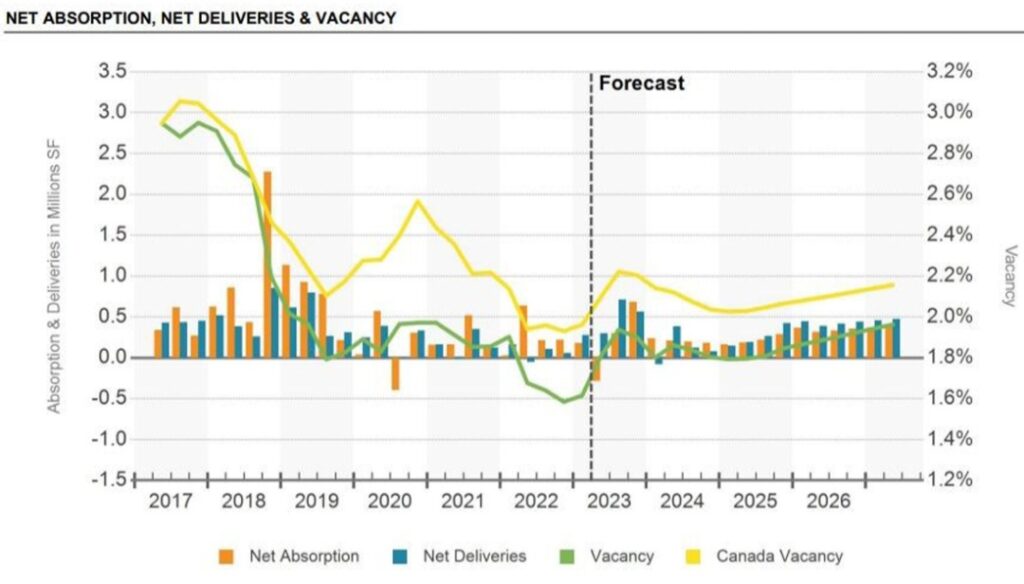
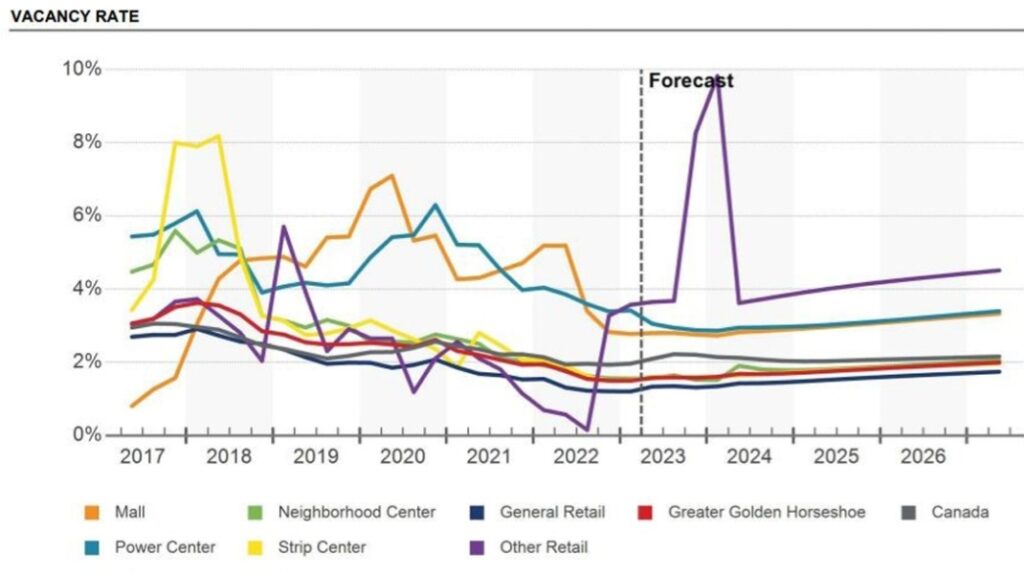
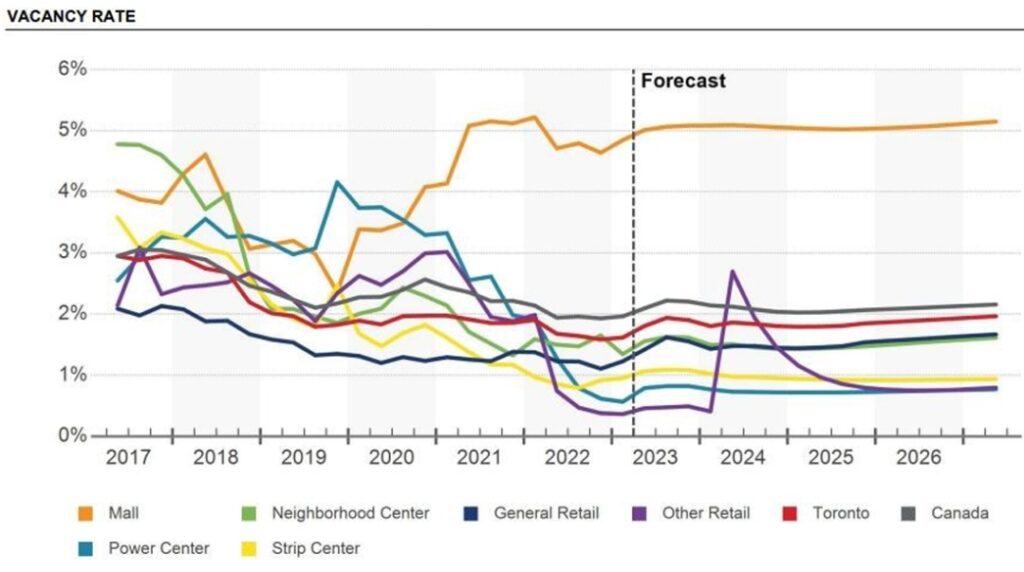
Vacancy in Toronto has softened to 1.6%, below the national average of 2%. Even though consumers are spending more, the effects of rising inflation and higher interest rates are impacting true growth in this sector. The rise in consumer prices positively affects landlords whose tenants’ rents are correlated with their sales, translating into increased rent growth. The ramp-up of food services will be a key factor in recovery prospects. After reporting full patios and reaching maximum capacity during the summers of the pandemic, patrons are eager to get back to it as full service restaurants and patios were given the green light to return to full capacity.
Quick Service Restaurants have and will continue to perform better, although sales across the market have yet to recover completely from pre-pandemic performance. Retail rents in Toronto have increased 3-4% YoY. Despite an overall increase in rents, there are many other factors to take into account with regard to retail rents and lease deals. Such as shorter terms and increased flexibility as well as percentage rent deals, meaning that a store would pay rent based on their in-store sales. In the Greater Golden Horse shoe, retail vacancy remains low at 1.5%, while rent has grown by 4.6% in the last twelve months.
Below the latest publish CoStar charts illustrate the story:
GTA Submarket Sales Trends
Sales Transactions Past 12 Months
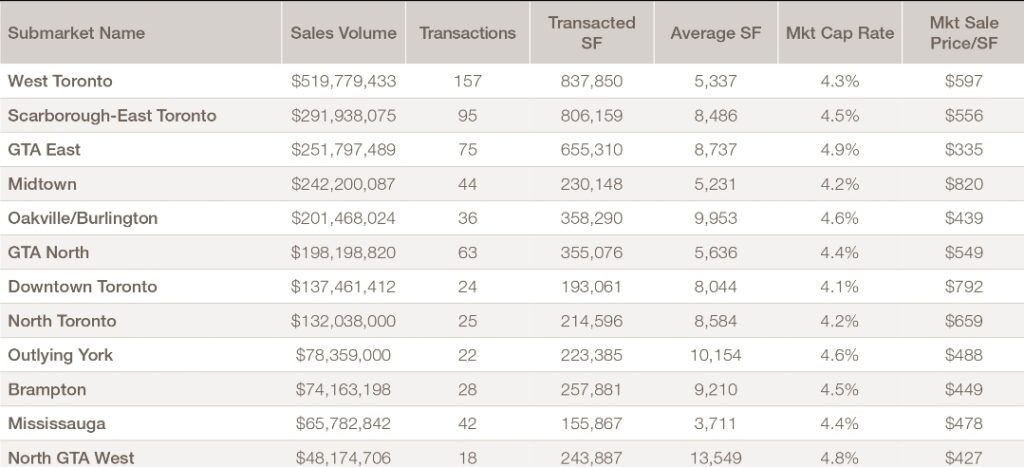
The chart above shows the highest number of transactions were in West Toronto, followed by Scarborough- East and GTA East. The highest Cap rates can be found in GTA East at 4.9% with the lowest in Downtown Toronto (4.1%). The highest market sales price per SF was in Midtown at $820 with the lowest being in GTA East at $335.
Construction Activity
There are currently 43 properties under construction in the Greater Golden Horseshoe. These properties total
899,333 square feet and 0.7% of the inventory.
Some notable properties being constructed this year are:
• 43-45 King Street East totalling 44,000 square feet to be completed late May 2023 (LiUNA Group)
• 1324 Rymal Road East totalling 51,315 square feet to be completed June 2023 (Petro Canada)
• 545 Holland Street West totalling 46,499 square feet to be completed December 2023 (SmartCentres)
Greater Golden Horseshoe Retail
Sales Past 12 Months
Sales Comparables Summary Statistics
